
|
Prospect vs Goal Report |
![]()
Overview
The Prospect vs Goal report shows bar charts comparing Prospects and goals by Product Profit Center.
Table of Contents
The Prospects that register on this report do not include DTQ's by the Auto Screen, as the Sales Org excludes DTQ's from its Prospect Goals.The report has detail pages by Rep and summaries for office and region. Click on the outline nodes on the Table of Contents to view summary pages.
Report Detail
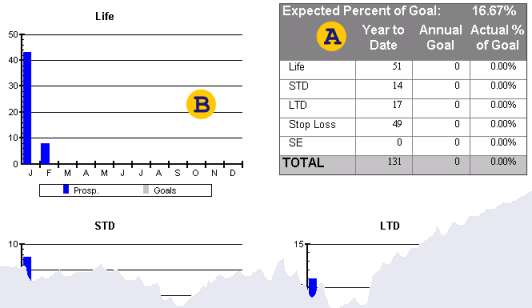
In the data area, you'll find the total year-to-date number of Prospects (excluding DTQ's), the annual goals, and the percentages achieved, all by Profit Center. The expected percent of goal is simply the number of the current month divided by 12.
The charts compare Prospects and goals for the current year.
