|
New Business Inventory Reports |
![]()
Overview
The New Business Inventory reports show the distribution of Coverage Groups currently in various RRAC activities per Underwriting Segment:
- by Office, Region and RRAC Person
- by Office, Region and RRAC
- by Rep, Office and Region
Table of Contents

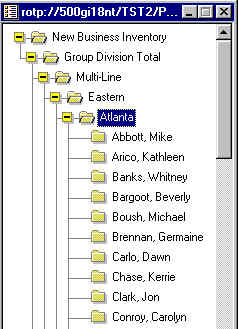
Report by Region and RRAC Person (left example):
- To compare Market Segments by RRAC Person, double-click the RRAC Person's name.
- To compare Market Segments by Region, double-click on the Region.
- To compare Market Segments by Office, double-click on the Office.
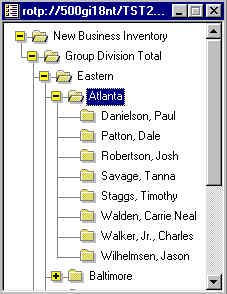
Report by Office, Region and RRAC (right example):
- To compare Underwriter activity by Market Segment, double-click on the Market Segment.
- To compare Underwriter activity by Region, double-click on the Region.
- To compare Underwriter activity by Office, double-click on the Office.
- To compare Market Segments by Region, double-click on the Region.
- To compare Market Segments by Office, double-click on the Office.
- To compare Market Segments by Rep, double-click on the Rep.
Report Detail
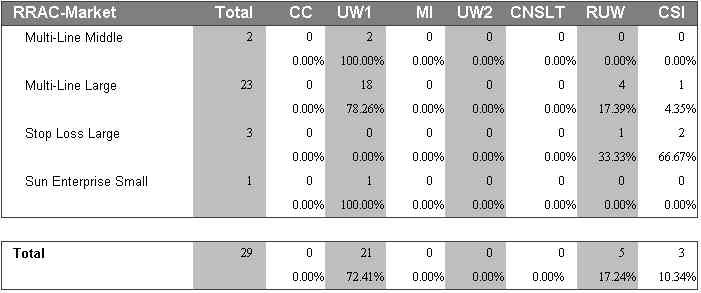
1) The portion of the report by Office, Region, and RRAC Person below shows a Market Segment comparison for a certain RRAC Person's Coverage Group activity:
Note that the Underwriting Segments on these reports are specific to the RRAC and are different from Market Segments .The total number of Coverage Groups in this RRAC Person's workload is currently 29, 21 of which are in an Underwriting 1 activity, 5 of which are in a Re-Underwriting activity, etc.In his Underwriting 1 activity, there are 18 Multi-Line Large Coverage Groups, representing 78.26% of the total Coverage Groups in his Underwriting 1 Activity for the Multi-Line Large Market Segment.The 21 Coverage Groups that are in the Underwriting 1 activity represent 72.41% of the total Underwriting 1 activities for all Market Segments for this RRAC Person.
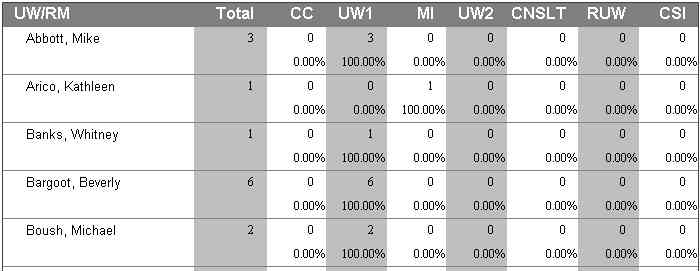
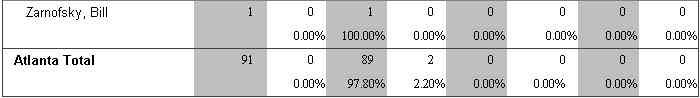
2) The portion of the report by Office, Region and RRAC below compares Underwriter activity for a certain Group Office. Summary information shows that there is a total of 91 Coverage Groups in process for the Atlanta Office, 89 of which are currently in an Underwriting 1 activity.Depending on what hierarchy level you select in the Table of Contents, you can view this same information for a certain Market Segment or by Region or Office.
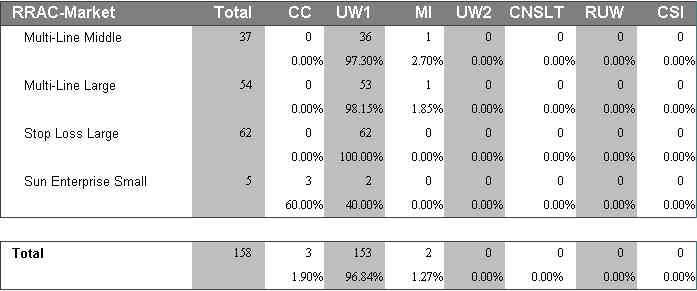
3) The portion of the report by Rep, Office and Region below shows Coverage Group activity by Market Segment for a certain Group Office. You can view the same information for a certain Rep by expanding the Group Office folder in the Table of Contents.For this Group Office, 5 of the total Coverage Groups in the RRAC are for the Sun Enterprise Small Market Segment, 3 of which are in the Create Case activity, and 2 of which are in Underwriting 1. The 2 Coverage Groups in Underwriting 1 represent 40% of the total Sun Enterprise Coverage Group activity in the RRAC (for this Group Office).