
|
Prospect Trend Reports |
![]()
Overview
The Prospect Trend reports show the number of Prospects received by month for the current and the previous year:
- by Office (comparing territories), Rep, and Territory (comparing offices)
- by Product Profit Center (comparing market segments)
Prospects are grouped by the number of days relative to the Due Date. Both reports have hyperlinked detail reports that are not visible in the Encyclopedia and can be accessed through hyperlinks only. To see the list of prospects that a number represents, click on a number of Prospects in the data area of the status report. The hyperlinked list is formatted as a Prospect Activity Report.Prospects for this report include all those that were received in the RRAC and not declined by Auto Screen.This report is dynamic. Prospects will move from left to right over time and will eventually end up in the 15+ category. Since the report is workflow-driven, but Prospects can have Coverages in different Coverage Groups and therefore be in different Activities at the same time, the system finds the Coverage Group for the Prospect that is least advanced in the process (its current Activity has the lowest sequence number) and uses this Coverage to determine Status.
Table of Contents
The report by Office, Rep and Terriroty has summary pages that can be viewed by clicking on an outline node on the Table of Contents. The report by Profit Center contains five pages only, one for each Profit Center.If a Rep gains or loses a territory, the Rep's historic activity will continue to show up in the current and prior year's data. (The Case always stays with the Rep.) Historical numbers can also be changed if errors on Distributor or Case assignments are later discovered.
Report Detail
 The first part of the report is a bar chart of the data. The prior year and the current year have different colors and are overlaid to make it easy to compare a particular month with that same month in a prior year.
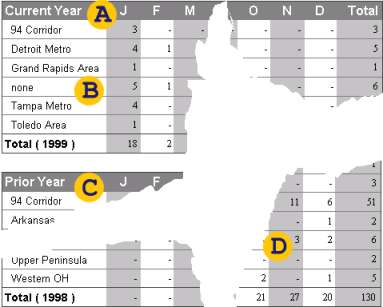
The first data section following the chart contains the number of Prospects for the current year by month and ...
... territory, or Group Office, if you are looking at a regional summary (or market segment, if you are looking at the report by Profit Center).
The data for the prior year will most likely show different territories.
The data area has columns for each month as well as total columns and rows.
