
|
Prospect vs Goal Comparison Reports |
![]()
Overview
The Prospect vs Goal Comparison reports show the number of Prospects received by month for the current and the previous year:
- by Office (comparing Reps) and Region (comparing offices)
- by Office (comparing Reps), Region (comparing offices) and Product Profit Center - detailed (comparing regions)
- by Product Profit Center
These reports are very similar to Prospect Trend Reports, except that there is additional goal information on the comparison reports and an estimated percentage of the goals reached.
Table of Contents
The reports offer summaries by office, region, Profit Center and Rep. To view summary pages, click on the outline nodes on the Table of Contents. A Totals section contains totals across Profit Centers for each level in the Sales Org tree.
Report Detail
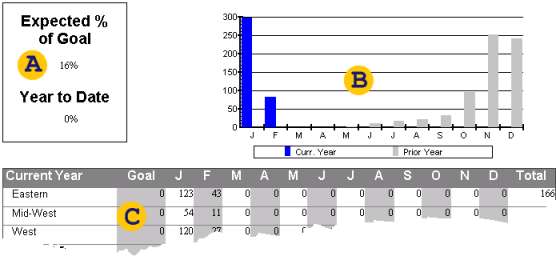
The Expected % of Goal is simply the percentage of the current year that has already passed. Year to Date is the percentage of the annual goal that has already been reached.
The chart shows monthly Prospects for the current and prior year.
The data section has a column for annual goals for both the current and prior years.


