|
Coverage vs. Proposal Reports |
![]()
Overview
The Coverage vs. Proposal reports show where most of the business gets lost. They list Coverages on their way to a Proposal by various parameters:
- by Office and Region: compares offices, Reps and Distributors
- by Product Profit Center: compares market segments by Profit Center
- by Rep and Office: compares products at different levels of the Sales Organization
- by RRAC Person: compares rolling 12 months
The Coverage vs. Proposal reports are similar to the Tracking reports, but they are designed for the Sales Organization (as opposed to users in the RRAC).The reports register Coverages that:
- are received in the RRAC
- are in process
- were declined at underwriting
- had rates released
- were declined because of uncompetitive rates
- had a Proposal released
Table of Contents
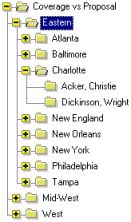
- To compare offices in a region, click on the region.
To compare Reps in an office, click on the office. To compare Distributors for a Rep, click on the Rep's name. Report by Profit Center
- To see a comparison of market segments in a Profit Center, click on the Profit Center.
Report by Rep and Office
- To compare products, click on any hierarchy level.
Report by RRAC Person (right side of above example)
- To show a breakdown of the last 12 months, click on a person's name.
Report Detail
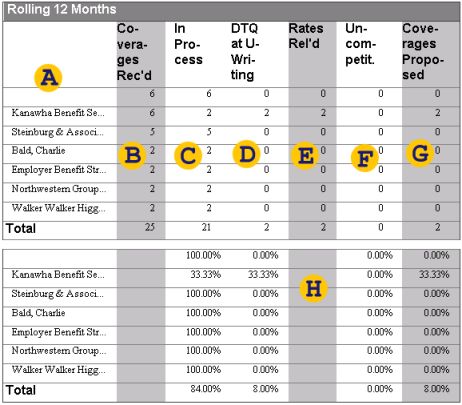
Here is how to read the Coverage vs. Proposal by Office and Region report: As of today (the day the Data Warehouse was built, displayed on all reports), for an unnamed Distributor, a total of 6 Coverages was received during the last 12 months. All 6 are still in process.
For Distributor Kanawha Employee Benefit Administrators, 6 Coverages were received during the last 12 months; 2 are still in process; 2 were declined at underwriting; and rates were released for 2 out of the 6. Of the 2 that had rates released, none was declined at Quote, and both Coverages were proposed (the latter is not exactly true, since we are only looking for a Follow-up on Quote Activity in the Activity History of the Coverage Group).Note: This reports shows the top 15 Distributors only.
Depending on what report and what hierarchy level you are looking at, you will see different items listed in the detail area. See the section on the Table of Contents for details. Depending on the report, the list consists of offices, Reps, Distributors, products or market segments.
All Coverages in the Data Warehouse were received; therefore this is the total number of Coverages and is the basis for the other columns. The RFP-Received Date for the Case determines the month when the Coverage was received.
In this context, Coverages that are still in the RRAC are considered to be In Process. A Coverage is in the RRAC if the current Activity of the Coverage Group is assigned to a person who has a RRAC role.
A re-quote, if it is currently in re-underwriting, would register as In Process as well as in Rates Released. If it is in re-quote, it would register in Rates Released only.
A Coverage was declined at underwriting if any underwriting Activity (1, 2 or re-underwriting) was followed by a Generate DTQ Letter Activity (or if the Coverage Outcome is DTQ following an underwriting activity).
Rates were released from the RRAC to the Field for a Coverage if the Coverage Group was in the Quote Activity.
A Coverage was uncompetitive if it was declined during quote, or, more precisely, if a Quote or Re-quote Activity was followed by a Generate DTQ Letter Activity.
A Proposal was released for a Coverage if the Coverage Group was in a Follow-up on Quote Activity at least once.
All reports of this type have a separate section that shows the same information using percentage values.
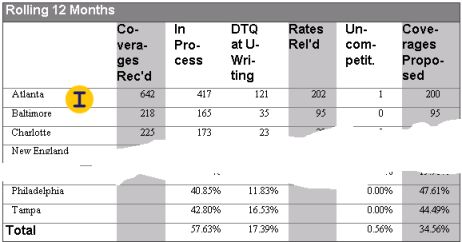
This is an example of an office comparison page on the Coverage vs. Proposal report by Office and Region.
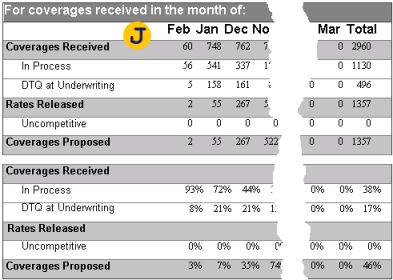
This is an example of the report by RRAC Person, which has a slightly different layout. The workflow dimension is flipped to the side and replaced with a monthly breakdown on the x-axis.